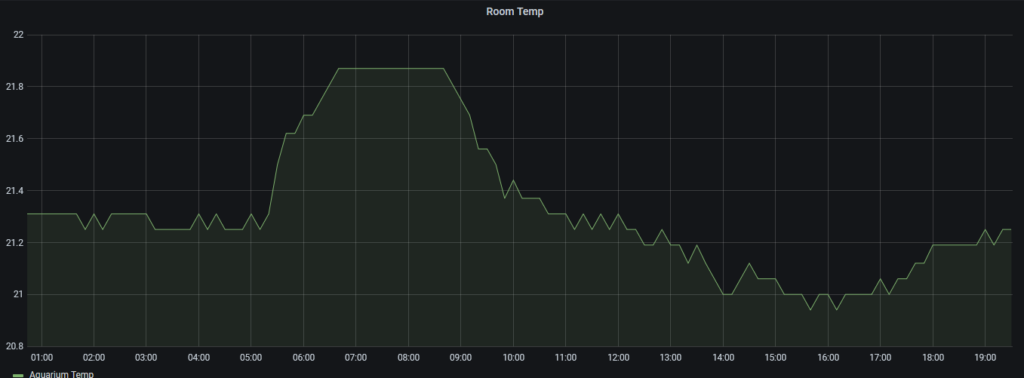
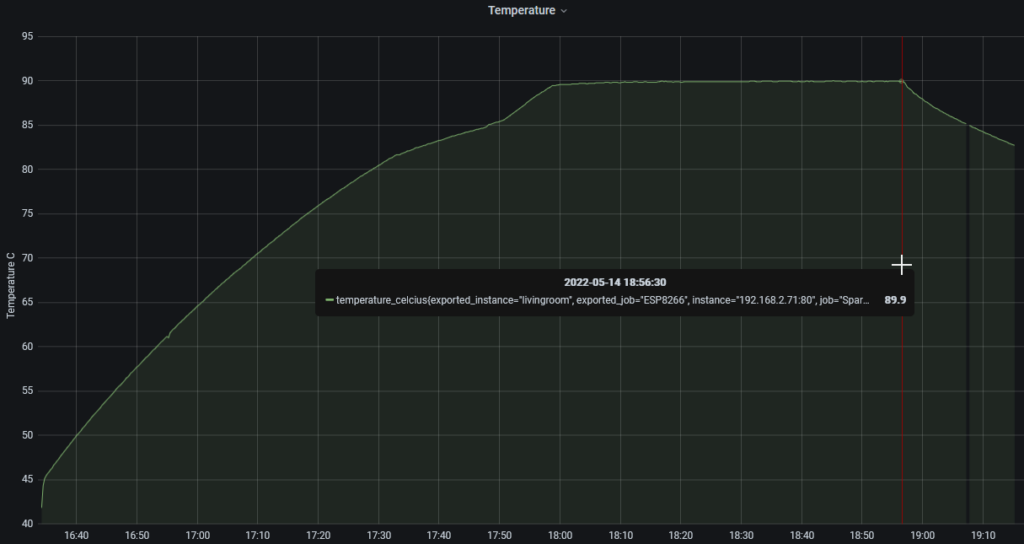
I have a programmable thermostat at home and being the indulgent human I am I have a rule set that the house starts to warm up at 5am so that when I get out of bed it is warm and not cold 😀
Of course that sounds good in theory but what proof is there that the thermostat actually delivers ;).
I setup a temperature logger to test how effective this actually was and I must admit was pleasantly surprised. Over night temperatures stayed at 21.3°C but as soon as 5am came around temperatures went up to 21.9°C enough that I feel much better getting out of bed in the morning.
“Who watches the watchmen” a question posed by Alan Moore has much broader implications into the realm of process control. The core of this political sentiment is accountability and it has broad applications to sensors and how we interpret their data.
Equipment fails and it is not a question of if but rather when. A good example is the 2019 Boeing airplane crash where investigations found that cause was a faulty angle of attack sensor. A very good research paper goes deep into this and I will be borrowing on this idea https://www.sciencedirect.com/science/article/abs/pii/S0952197622000744. The root of the argument is how do you trust sensor data. If you have 1 sensor and it is providing you faulty data you do not know, with 2 sensors (one good & one faulty) you can see the sensor data is different but you won’t know which one is right and with finally 3 sensors (two good & one faulty) you can have the sensors ‘vote’ on the correct sensor value and then tell which is faulty. The obvious error is if you have 2 faulty sensors out of 3 the wrong value will be chosen. This can be extended infinitely but the probability of 2 faulty sensors that are regularly checked is unlikely and so 3 sensors is the agreed norm for critical voting processes. The previously noted research paper goes into how 2 real sensors and a virtual sensor could be used to the same effect and has some really interesting implications to save on sensor cost.
Extending this to process control we can have the exact same failure modes. One example is a control valve used to control fluid flow rates. If said control valve fails (“Gasp, by God how could a control valve ever fail or stick” /s) how would we know. The most trivial solution is to have a “watcher” for all control points. If we have a control valve to control fluid flow rate we need a flow meter to measure the effect of that control valve. This way if the control unit is faulty we can measure that and then investigate. The concern is that if the flow meter is faulty we can have false negatives or fail to catch true negatives. For true critical to safety (CTS) or critical to quality (CTQ) parameters is may be beneficial to design processes with redundant sensors or innovative intertwined solutions.
One real life example is a steam heater used to heat a process stream. We had a control valve fail (after root cause analysis with maintenance we found that it was damaged and was very prone to sticking) and the sensor measuring the flow rate (well not really measuring flow rate but rather pressure differential and then estimating flow rate) was not able to pick up the failure. This would be a catastrophic failure leading to over-temp material but we had temperature sensors in the material being heated by the steam and so were able to catch this condition. The main point here is processes overlap. Surface level views may indicate the faulty valve and sensor are isolated but their effects affect downstream processes so it is possible to detect their failures through downstream sensors.
What this also implies is that failures in a large complex processes can be caught by direct process sensors as well as downstream sensors much further down the line. Another example to show the point is in a boiler where if the heater (gas, electric, etc) fails and the temperature sensors itself fails to catch it, downsteam processes that use the boiler stream would be able to catch this failure due to low pressure or low temperature.
Interconnecting a process like this and creating a system to catch failures like this can be very difficult work and poses its own risks but the core tenant of “Who watches the watchmen” is something all process engineers should be aware of as both equipment and sensors fail and may have significant impact to process.
In the past I thought the the typical way of measuring a materials density is to measure its volume and then weigh it. As there are obvious difficulties and flaws (fluids can evaporate during measurements, volume size errors) a different way is to use a refractometer which uses a fluids index of refraction to estimate it’s density/etc. These all have to be calibrated for the particular working fluid and I have one made for ethanol. It is a good tool and a non destructive small sample way of finding the alcohol %.
After calibration at the low and high end I was able to measure the alcohol% in various drinks and found some that under deliver. One key thing to note is to never take measurements blindly as alcoholic beverages that have high sugar content can artificially change the alcohol% as it changes the fluid density.
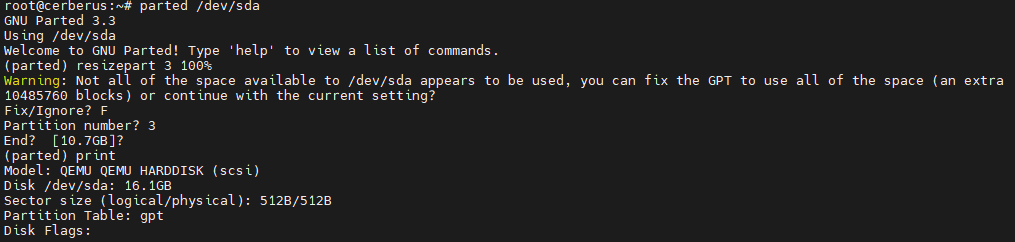
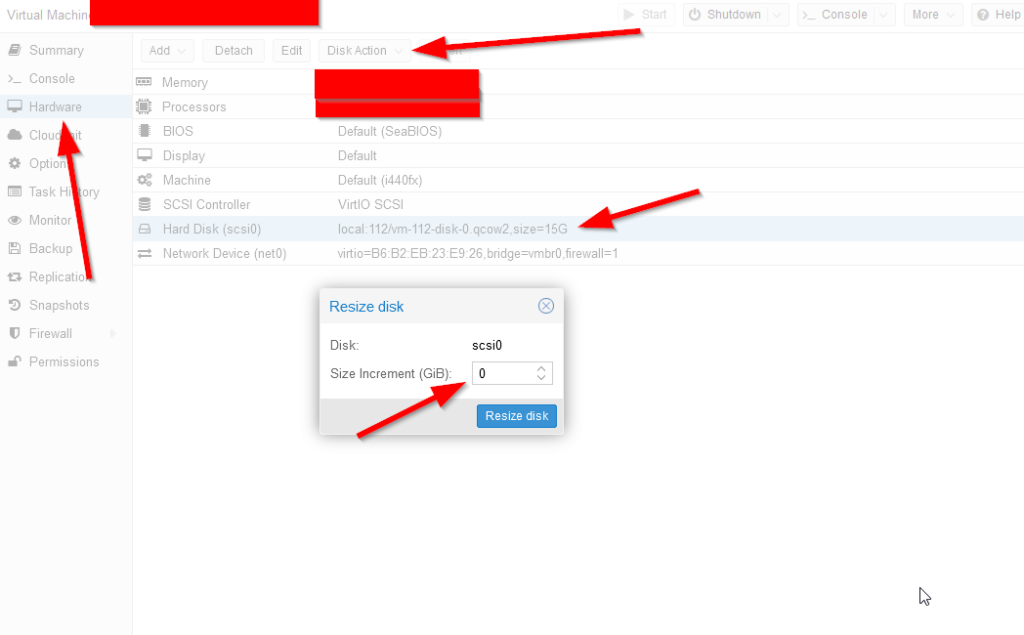
After some software installs one of my PROXMOX virtual machines is running a bit low on space. More of a note for myself this is the process of provisioning more space pulled right form the official page.
Select the VM, Click on Hardware, Select the disk, and under disk action select the incremented increase.
Being interested in tech, food and having a chemical engineering degree this is a personal favourite topic of mine (and may be a bit of a rant). Pasteurization is all about statistics and killin’ microbes.
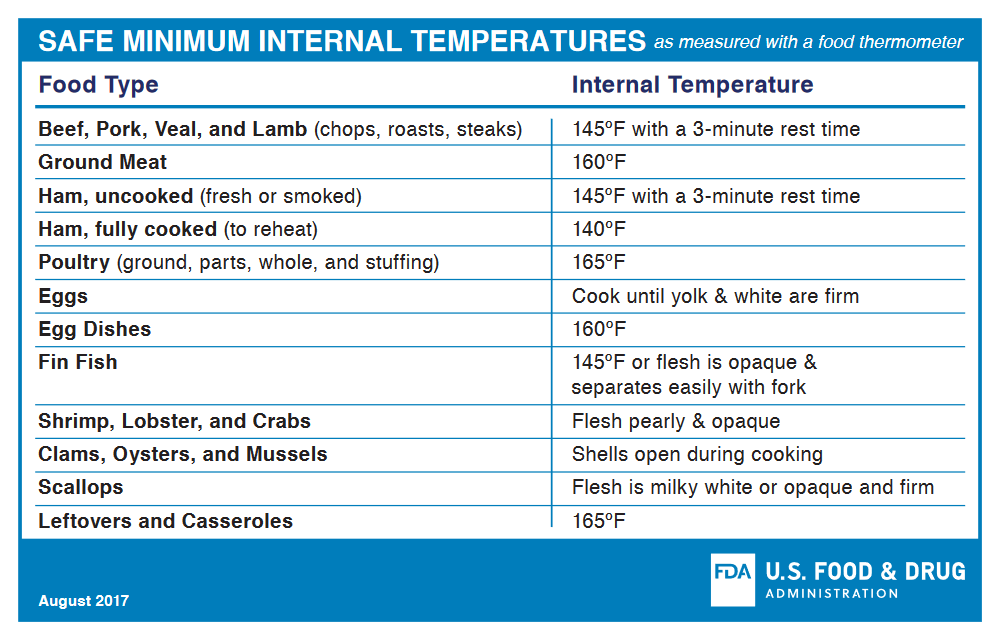
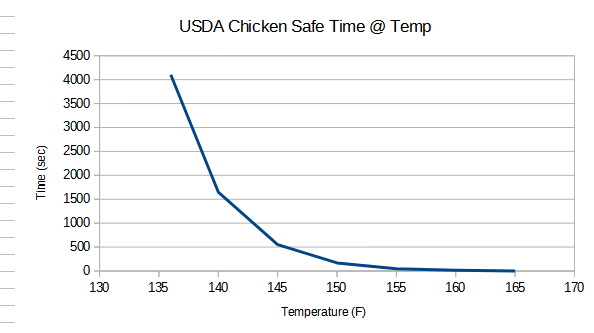
Microbes aren’t smart. They don’t sit around waiting for the 165F safe internal temperature for chicken (as deemed by the FDA below) and die. The 165F chosen by the FDA is based on a bit of science and statistics and by using the same tricks you can actually go lower.
Microbe death follows a first order death equation dN = -k*N*dt where N is the size of the microbial population and k is the death rate. Where the factor k itself follows k = A*exp(-E/RT). Long story short, the decrease in a microbial population size is affected by time and temperature (different microbes behave differently).
This equation isn’t used too much in industry instead going with decimal reduction time z= (T2-T1)/[log(D1)-log(D2)] which defines the time required to reduce a microbial count by 90%.
What this all boils down to (great pun), is that the FDA safe internal temperatures values are based on the temperature at which we see a 7 log10 reduction in microbial content instantaneously. This is good for the government as their recommendation is very conservative and they can’t be blamed for anything other than dry chicken.
To cheat the system we can achieve the same 7 log10 reduction at a lower temperature but a longer time. There are curves for this but for example with chicken we can achieve this with 58c for 64 minutes meaning we can have both safe and juicy chicken (talk about having your cake and eating it too).
This is cool and all but the astute will note that a 7 log reduction is 99.99999% effective but not 0 and microbes just like cockroaches will multiply. If you leave one alive it will come back with more. For this the government uses a bit of statistics and for shell stable foods uses a 12 log reduction. Now a 12 log reduction also doesn’t guarantee 0 microbes but we get down to such small numbers that spoilage probability and economics take over. For a given set of starting microbes, a 12 log reduction and for R amount of containers you can estimate how many containers will have microbes out of a batch and if it an acceptable amount. So unfortunately the chances of buying processed food and having food poisoning are never 0 but are managed to safe levels.
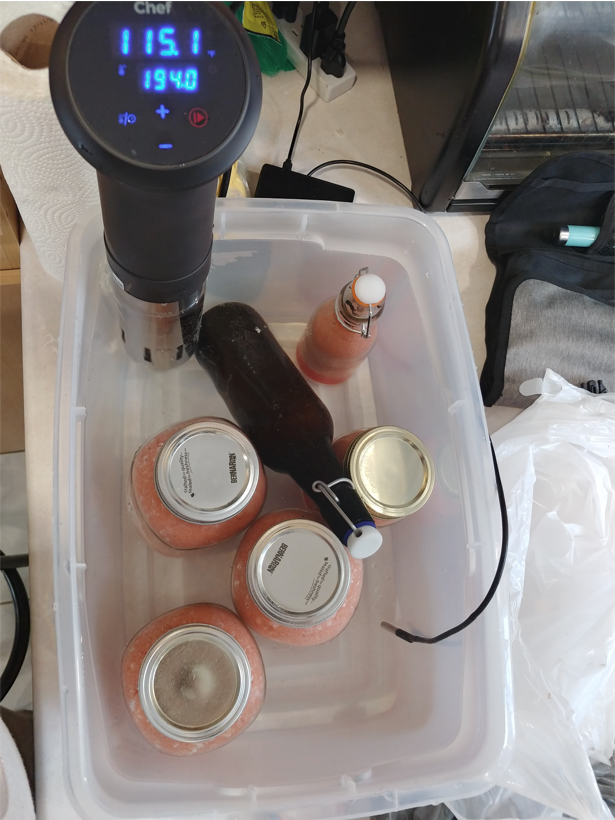
Working in the food manufacturing industry, pasteurization is a critical step to ensure food safety. Now I don’t have any industrial ovens or equipment at home but I can get fairly close with home equipment. A follow up to my strawberry compote recipe https://adam-s.ca/strawberry-rhubarb-compote/ I decided to try pasteurizing the drink so I can extend its shelf life as I will be bringing these on a outdoor trip a week from now.
I will not get too deep into thermal death kinetics (but its a great topic for another time). But for pasteurization time and temperature matter most. I can use high temperature for a short time or lower temperature for a longer time. For this case I pasteurized at 90c for 1 hour (plus the startup time). I setup my sous vid for 194F (90c) and a probe along side it and put in my bottles and jars to be pasteurized (picture bellow). In industry I have used Datapaq at few different jobs to confirm the time at temperature which is critical to process and was able to emulate that with my own probe & logger. I was able to confirm exactly 1 hr at 90c and almost 2 hours at 80c which proves sufficient for pasteurization.
This was a fun project and I was very happy to see such a consistent temperature profile, now if only temperature profiles were so “text book” at work :D.
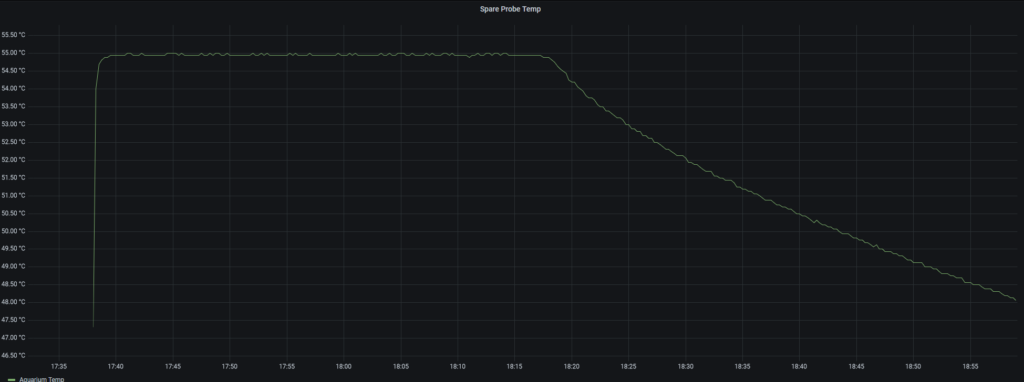
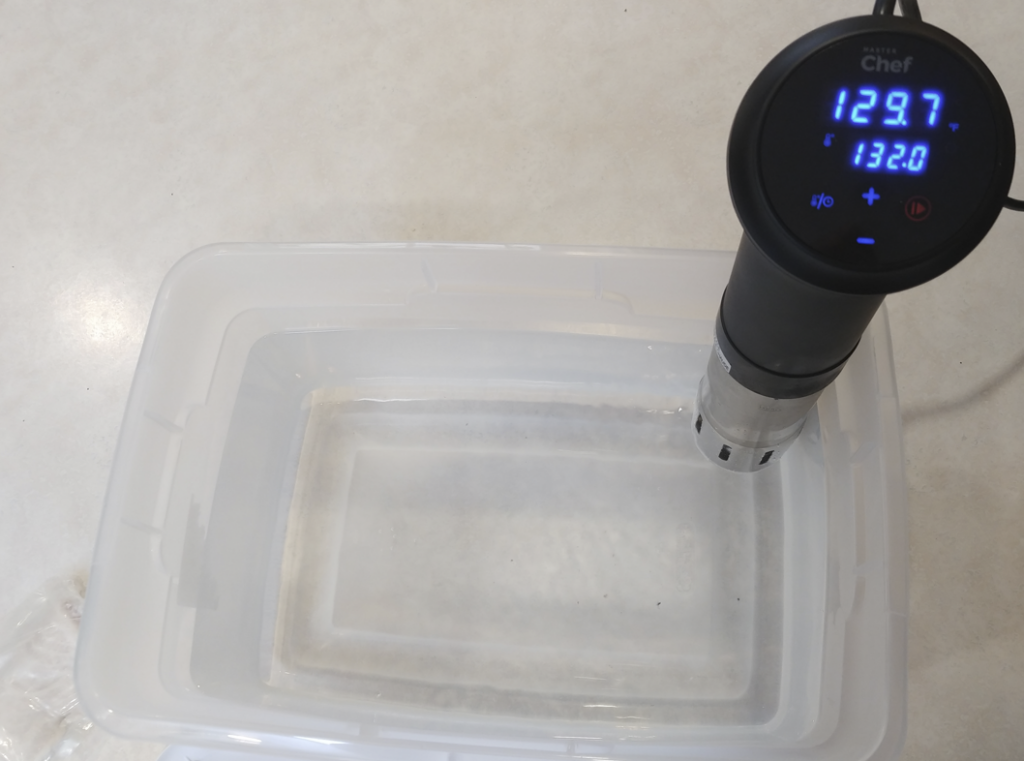
I have purchased a new sous vide machine and as always it has to be broken in and tested. I have found digital temperature sensors to be repeatable but sometimes inaccurate and so offset have to calculated for each of these machines.
I have a master chef unit and the test was controlling water at 132F (55.56 C). I dropped in a logging probe to confirm this. The chart below shows a very tight temperature grouping but the average is at 55C and not the 55.56 the sous vide was controlling to. So in the end I have a very repeatable and controllable unit but it is 0.5C off which I can alwaysaccount for.
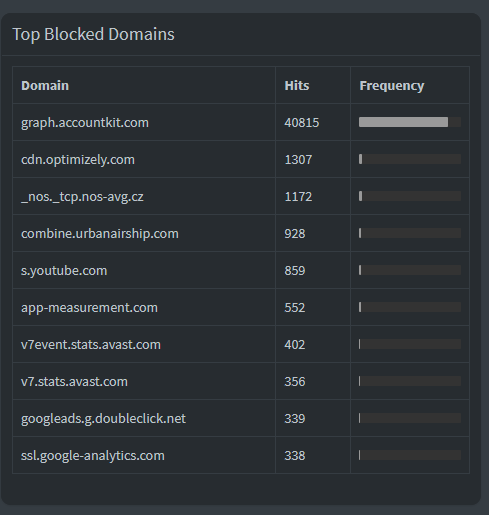
Follow up on my previous post https://adam-s.ca/cell-phone-tracking-pihole/. The top blocked domain by an exceedingly large margin was graph.accountkit.com. After a bit of research turns out that that this is facebook’s tracking api, and that facebook messenger was the key culprit in this over usage.
Many people underestimate how much data their phones upload. I use PiHole as a DNS filter and cache so I can track outbound requests. I noticed that during the same time of day a significant portion of my blocked requests disappeared. Turns out this is exactly when I leave and come back from work. The culprit was my cell phone trying to send usage data that pihole was blocking successfully. I will post the blocked queries later.
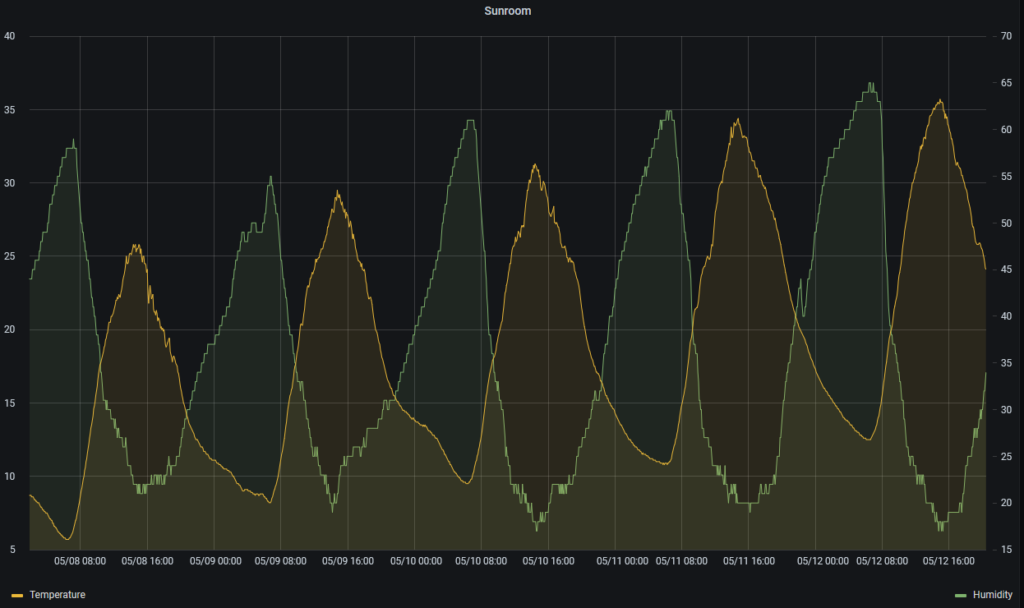
I monitor temperature and humidity in my sunroom. An interesting trend can be seen when overlapping humidity and temperature. As the sunroom is an uncontrolled environment when temperature increases during the day humidity drops down but at night when temperature comes back down humidity comes back up.