I wanted to share some of my person dashboards that I run off of Power BI.
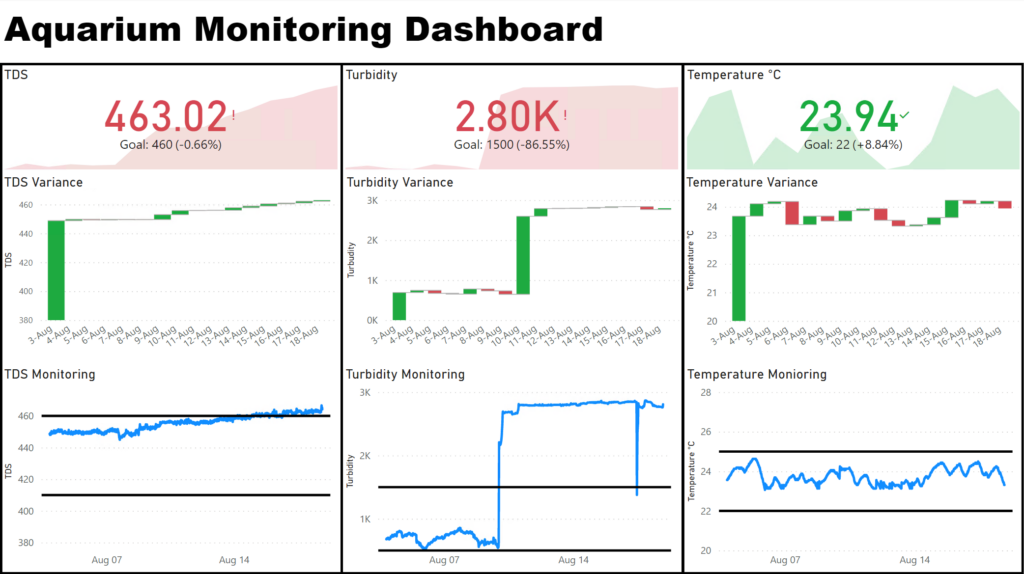
The first one is my aquarium monitoring dashboard which I use to monitor my KPI. Now its been a while since I did a water change so you can see my TDS is out of spec and I recently moved my turbidity probe to a more appropriate location to properly manage the tank. I have 3 quick cards to see if I am green or red and then further charts to show daily variances and the time series trend at the bottom. I have some alerts that go out when I go out of tolerance but as can be clearly seen I don’t necessarily change my water immediately. (Before anyone freaks out, I have a heavily planted tank so I have a healthy equilibrium that allows me to do infrequent water changes).
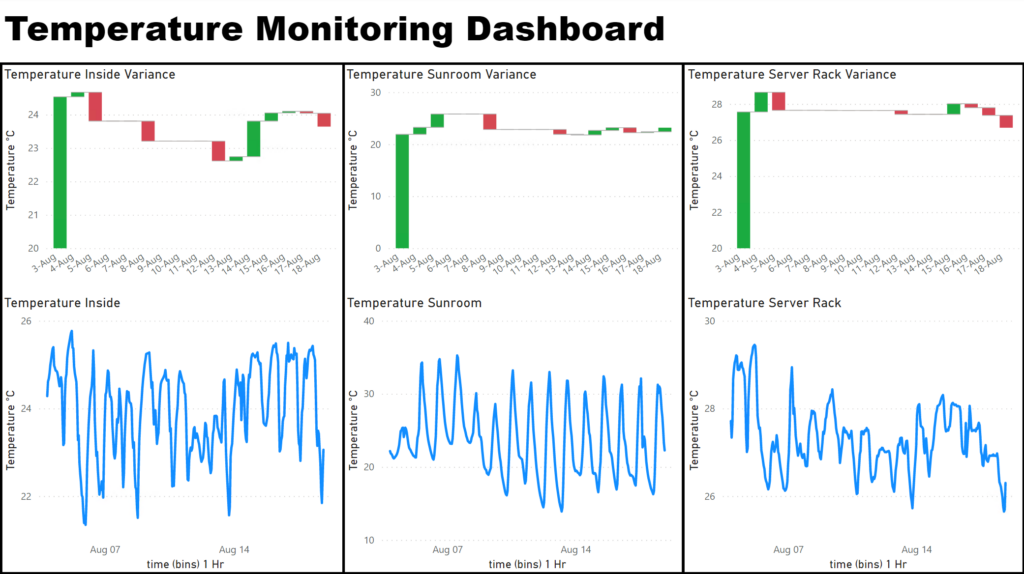
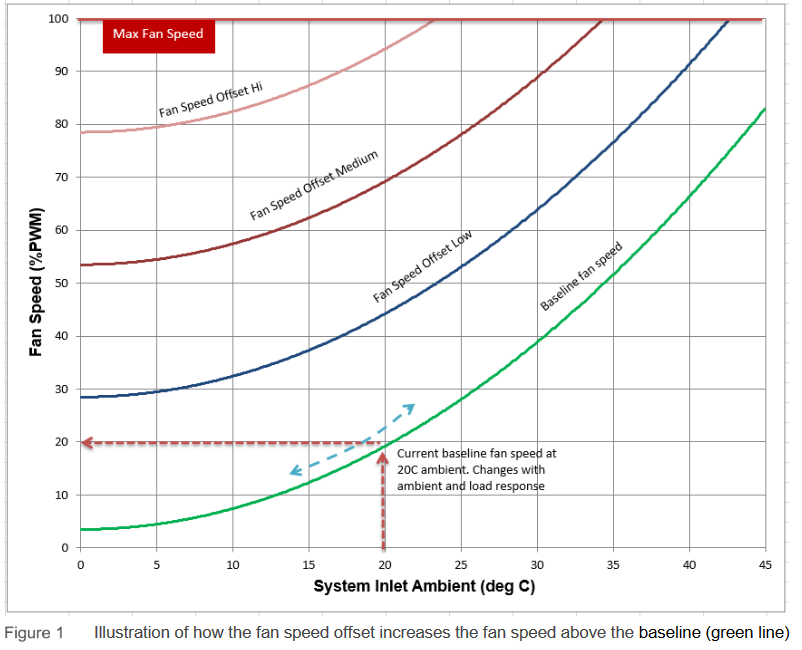
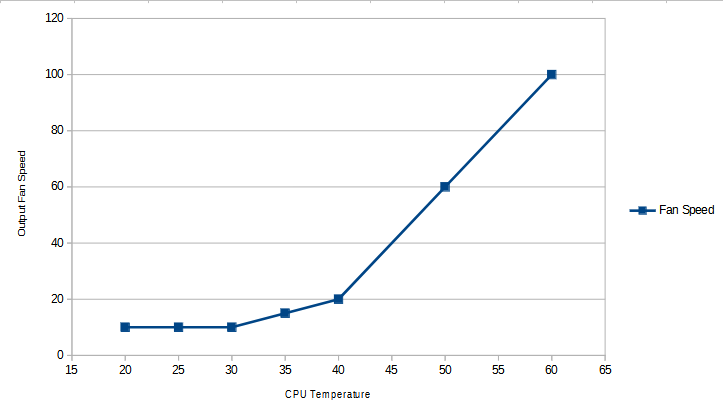
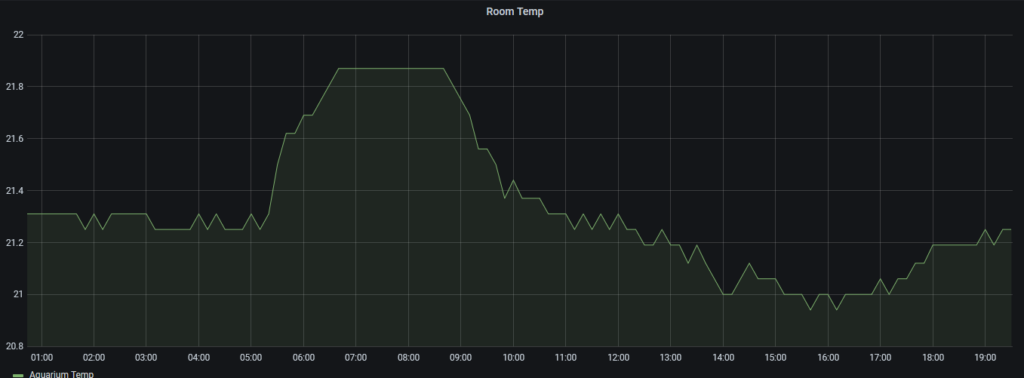
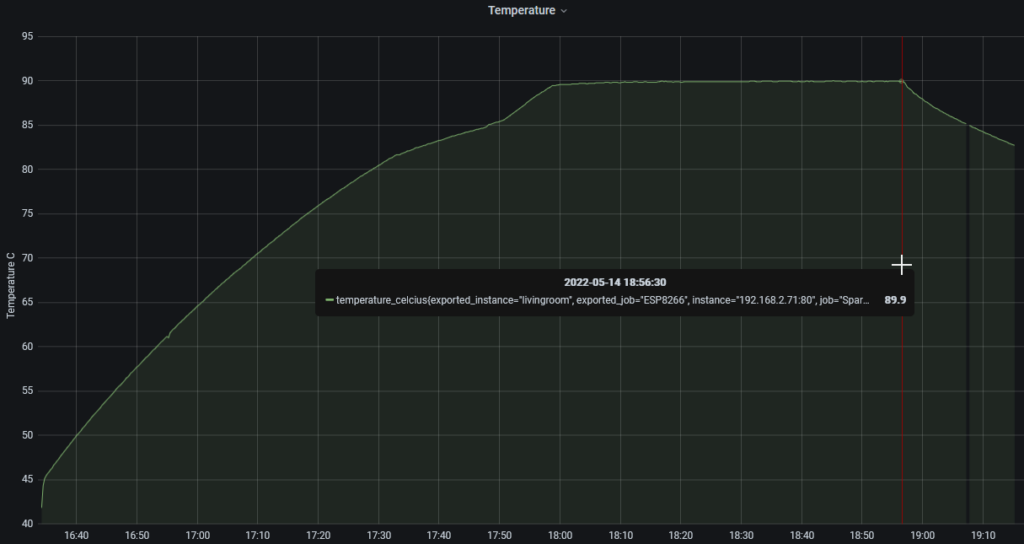
Next I have my temperature monitoring dashboard that I use to track 3 main temperatures: my room temperature, my sun-room temperature (and by extension my outside temperature) and my server rack temperature. There is not much to note but I do use the server rack temperature to ensure good operation of equipment. I don’t want to run my server to hot as that my cause early device failure.
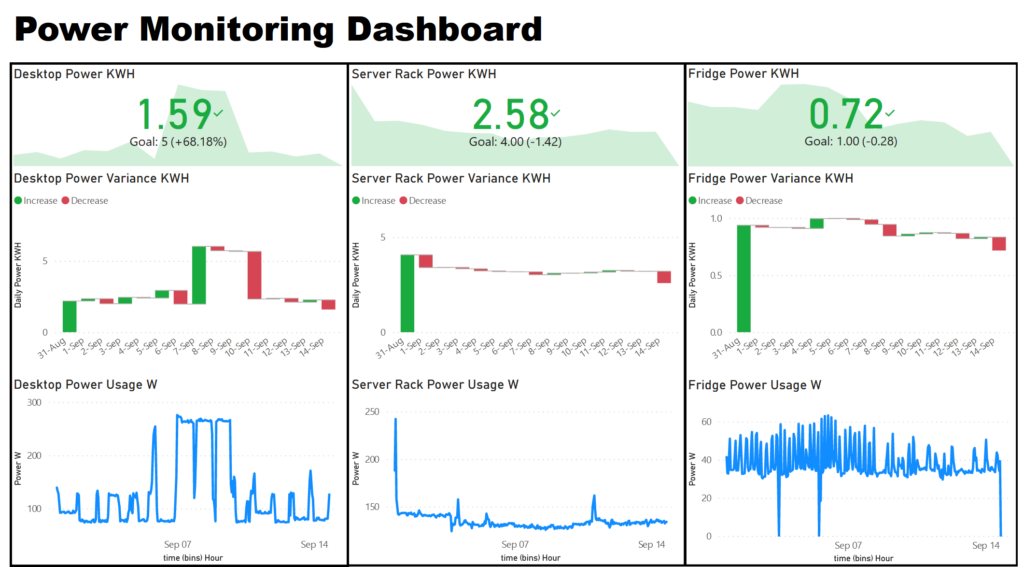
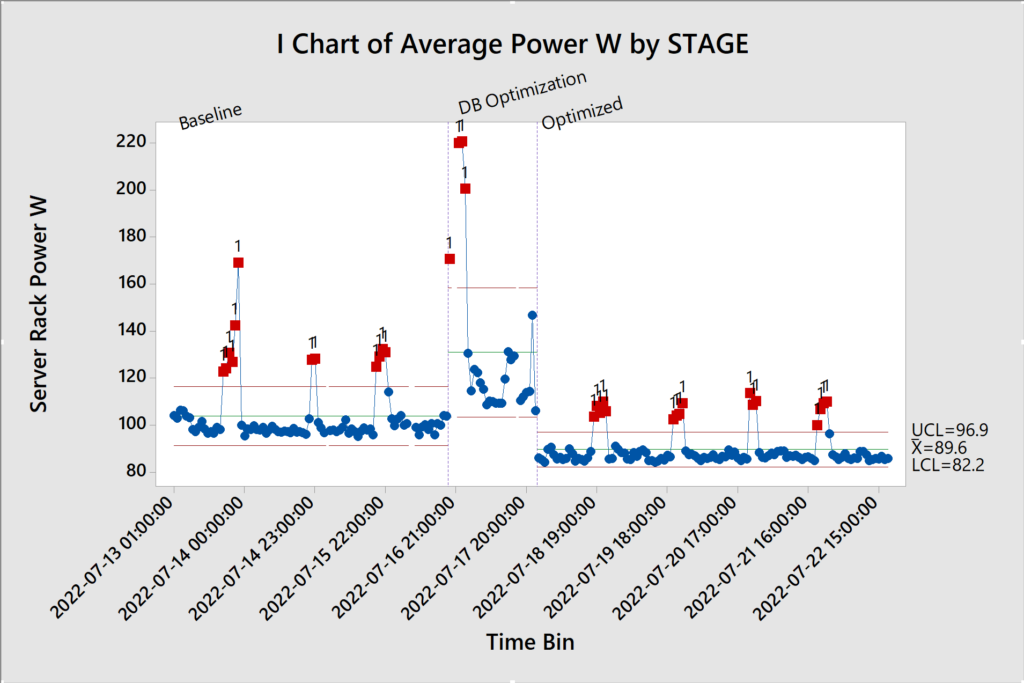
Lastly I have my power monitoring dashboard, where I track my desktop computer, server rack and fridge temperature. I track my desktop power usage to understand costs associate with use and to track GPU mining profitability. Server rack power as an important one as well as server hardware is known to be a big power draw. I spent a fair bit of time optimizing power usage and this dashboard was important in tracking those changes.
Overall I have much more work related dashboards but these are the ones I run on my personal Power BI workspace.