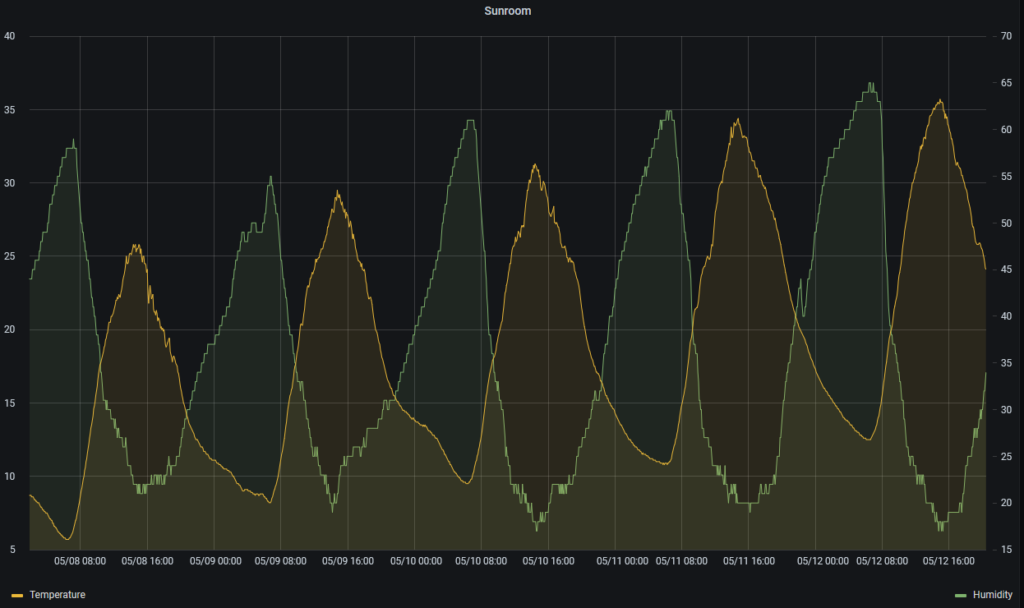
I monitor temperature and humidity in my sunroom. An interesting trend can be seen when overlapping humidity and temperature. As the sunroom is an uncontrolled environment when temperature increases during the day humidity drops down but at night when temperature comes back down humidity comes back up.
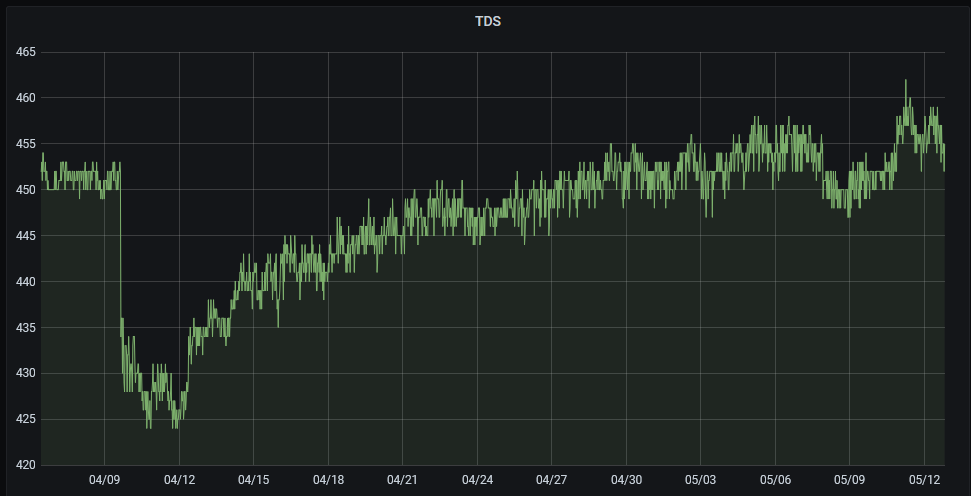
Analyzing my aquarium total dissolved solids (TDS) a neat trend can be noticed. A water change was completed on the 9th which resulted in a dramatic drop in TDS but over time the TDS had risen back to its previous levels. As this the aquarium has an open top, water will evaporate and lead to an increased solids concentration. A water top up was completed on the 8th and there was a drop in TDS related to that as well.
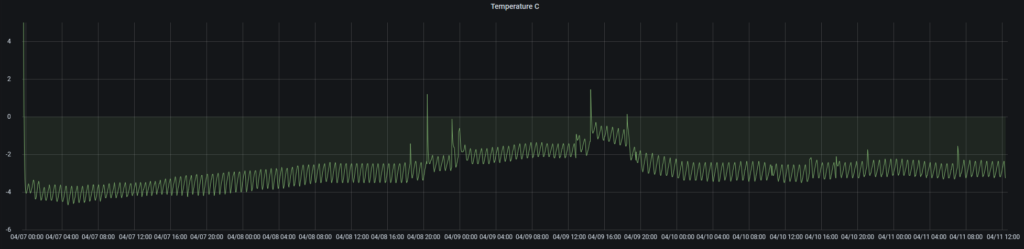
A follow up for some of the takeaways of the previous post (https://adam-s.ca/understanding-fridge-temperature/). Repeating the experiment in a different part of the fridge showed some cleaner results. In-fact there were oscillations present at a much more realistic interval (30min). This was very surprising as this is a mechanical fridge with a thermostat and the oscillating period was dead on 30min almost as if it was computerized.
The temperature logger was able to go for 4.5 days on the external battery bank.
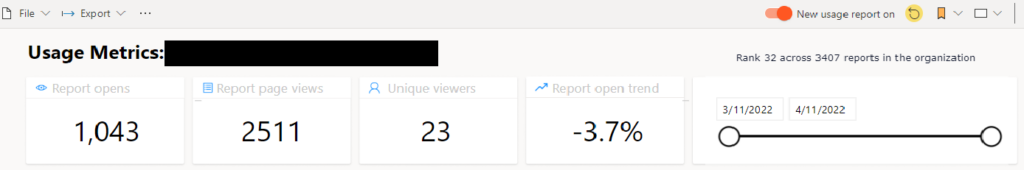
One of my Power BI reports has reached the top 1% of all Power BI reports for the whole international company. A few keys to getting my report to this point.
Value to users: I tailored many aspects of the report to be more suitable to users in different departments giving them a reason to use it and widening the amount of people interested.
Automated Reports: Many daily and weekly status and trends were automated through power automate where users could quickly see top issues and then links were added to go to the Power BI report for further trends.
TRAINING, TRAINING, TRAINING: Many users are still new to Power BI and are unaware of what data is available. Training sessions and more commonly training videos were a key in getting users more engaged and involved.
Following the basis of https://adam-s.ca/quick-temperature-logging-probe/ I setup a wireless temperature probe to monitor the temperature in my fridge because who knows what the temperature is when the dial is set to 3 😉 (there is a joke about a fridge that goes to 11 somewhere there).
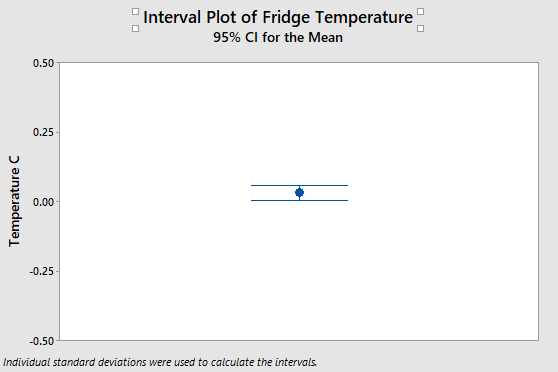
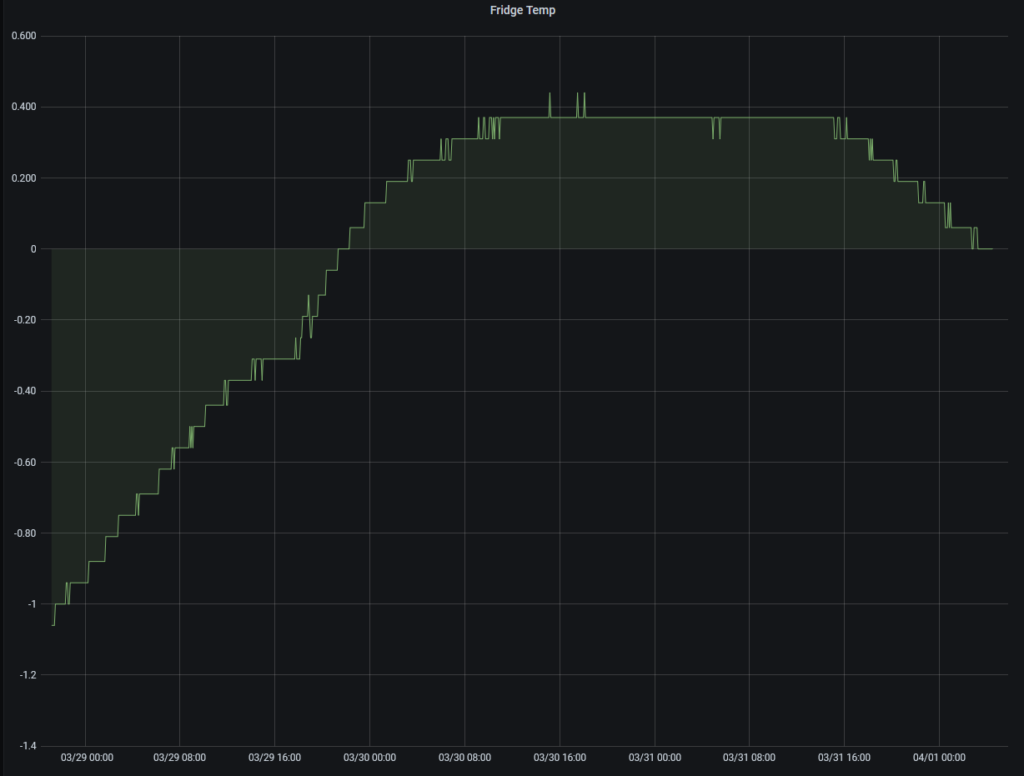
Results were very surprising as the 95% confidence interval was so tight together I though something was wrong. Looking at the trend chart we see that there might be some oscillations if we tracked for longer but this was already a 3-4 day time frame O_o. It would be extremely shocking to me if there were oscillation with a period of 7-8 days.Follow ups.
Follow ups & Notes
Trial with different locations as obviously positioning further away from cooling coils will have higher temperatures.
Trial with larger battery bank to get large time frame trending
This was done on a cheap & old mini fridge so there might be value in testing newer hardware.
The fridge was heavily stocked with high heat capacity items so hysteresis may be playing a bit of a part here.
Higher polling frequency, though 15s should be more than frequent enough.