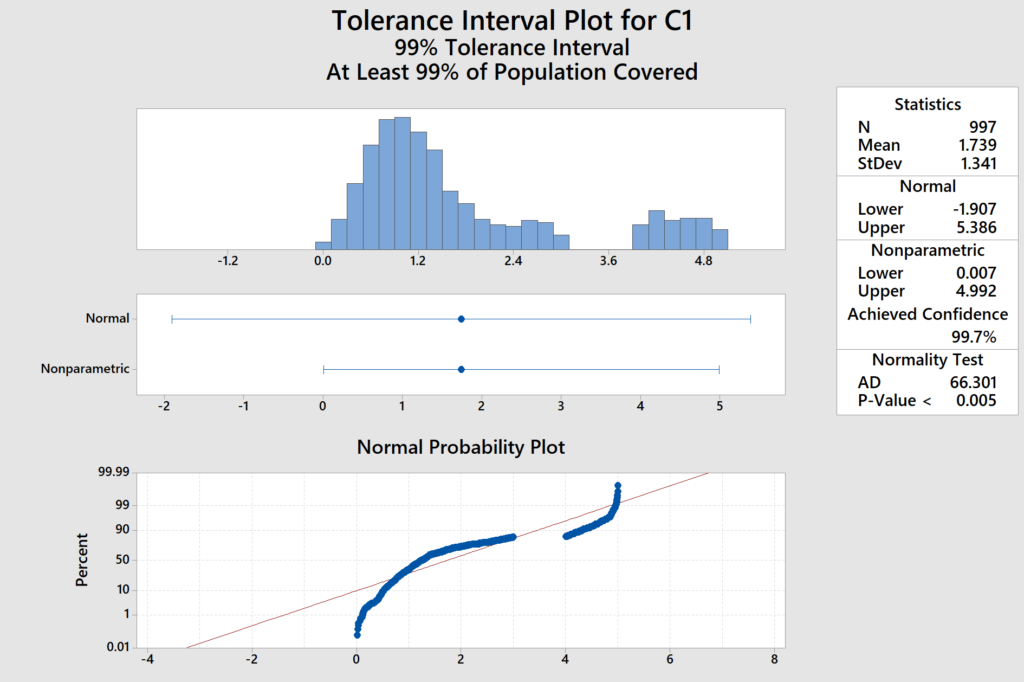
Many people assume perfect normal distributions when looking at data, but this is not always the case. An example data set is shown below where the data is clearly non normal and both the normal and non parametric tolerance intervals and means are shown. The mean is obviously the same but the 99% tolerance intervals show some key distinction. The normal tolerance intervals overestimates and unrealistically goes to -1.907 because it assumes a normal distribution and “equal” datapoints on both sides of the mean. This is not the case and the non parametric tolerance interval is obviously more accurate as it takes into account the “Real” aspect of the data.
I know many people just default to always assuming their distributions are normal but this is not always true and wrong assumptions tend to backfire when it comes to statistics.